Guide to interviewing AI Agents
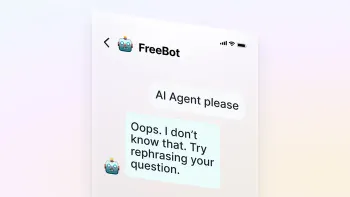
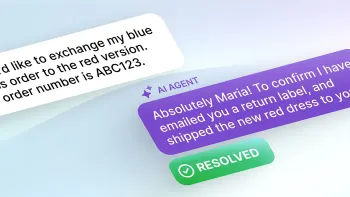
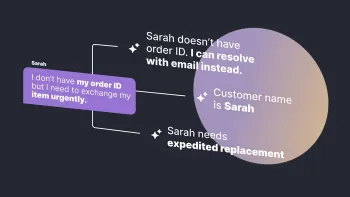
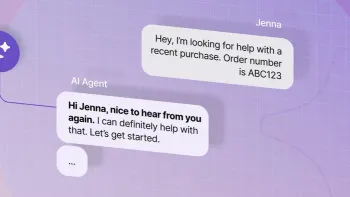
Last year, we introduced our all-new AI Agent, capable of solving any and all unique customer problems with no manual coding or script creation, entirely powered by generative AI. But what makes an AI Agent different from the typical chatbots you’ve used in the past? And why are companies like Square, ClickUp, and Wealthsimple choosing to hire an AI Agent instead of training a chatbot? Is the impact on ROI really that high?
Learn More